Has your program grown to a such a gargantuan size, such that you can't tell what is messing with your data? Never fear, data breakpoints are here. Data breakpoints are one of my favorite debugging tools. In Mesen-SX, they are often referred to as read/write breakpoints.
To create one:
-
Go to Debug->Debugger or press Ctrl+D.
-
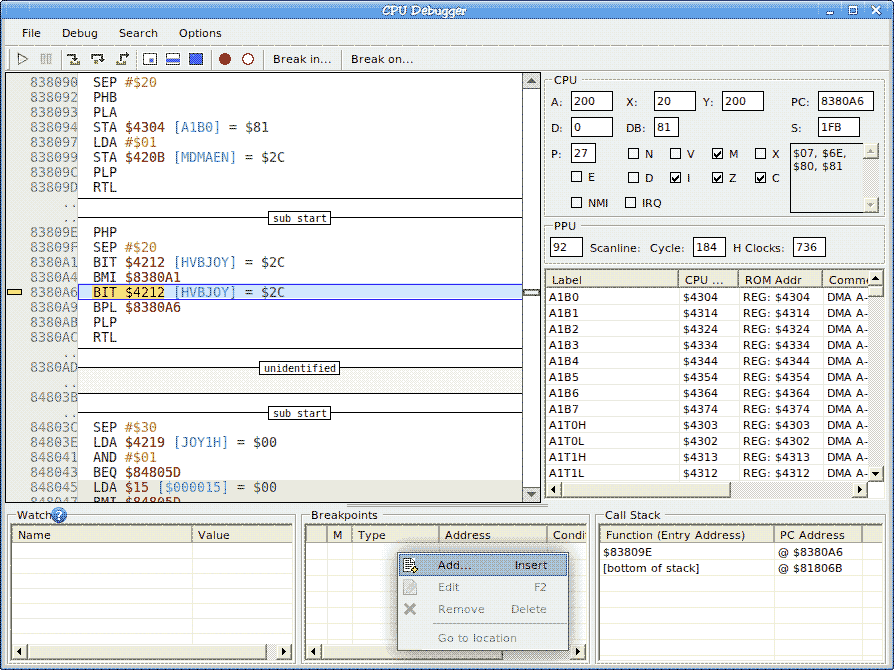
In the bottom panel, you will see a frame called "Breakpoints"
-
Right click and select "Add..."
- Choose "Work RAM" in the Breakpoint Type dropdown menu.
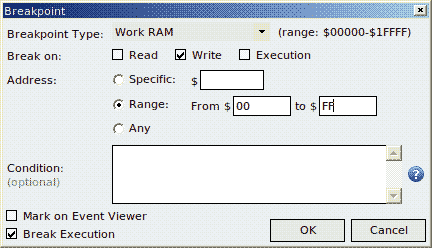
- Then check the read and/or write checkbox to trip the debugger when your variable is read or written to.
- If you have a particular variable you want to track, select the "Specific" radio button and type in the memory location (protip: # is the address-of operator in 65x, but use that in your source, not this breakpoint window!), otherwise you can select a memory range or "Any" for the whole space
- Select "OK"
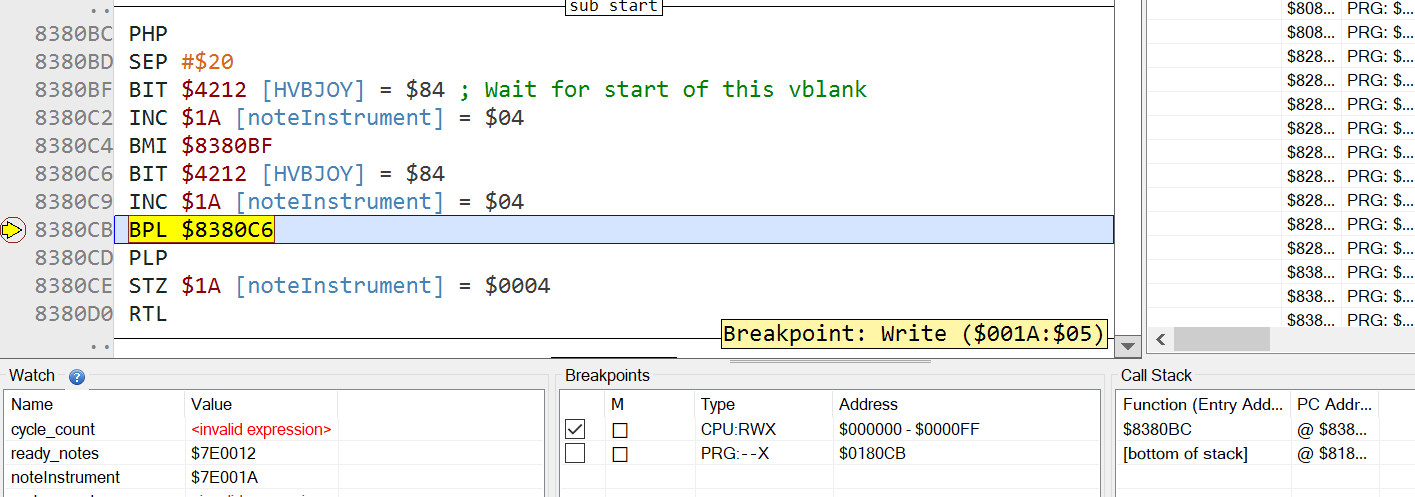
When the variable you have set a data breakpoint on is read/written, the debugger will stop on the following line. Aha! There's the culprit.
Note: Mesen-SX cannot yet distinguish between labels in audio RAM from labels in S-WRAM (https://github.com/NovaSquirrel/Mesen-SX/issues/71)
Tutorial by jeffythedragonslayer